CyberFreezeDev Loading
  1. Home
  2. Products
  3. Cybe Social
  4. Analytics dashboards

Social media analytics that say what each number means

Post, platform, follower and ad numbers in one place, each with its caveats stated.

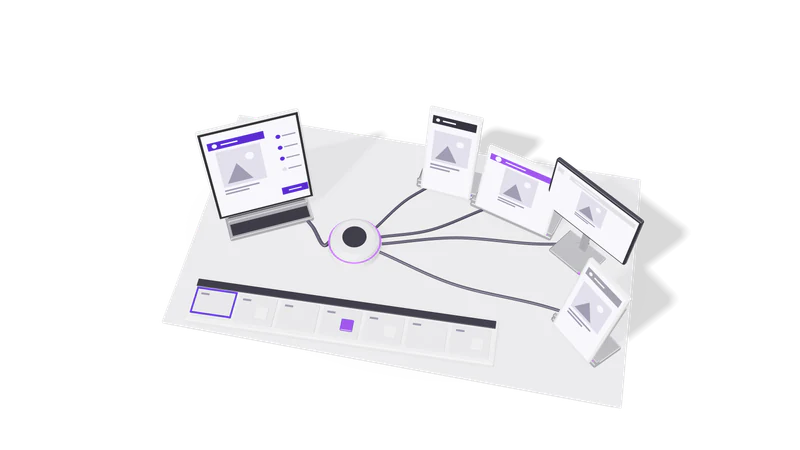
3D render of a composer tablet sending one post through a hub to four account screens

Four views

Post analytics

Engagement for one post, read from the platform that published it.

Read more about Post analytics

Engagement numbers for one published post, read from the platform that published it. Only posts this organisation published through Cybe Social are shown.

Platform dashboards

All-time totals for LinkedIn, Facebook, Instagram or YouTube; one outage does not block the rest.

Read more about Platform dashboards

All-time totals for published posts on LinkedIn, Facebook, Instagram or YouTube, or all four at once. If one platform is down, the others still load and that one shows its error.

Audience

Live follower counts per account, with the change since the earliest stored reading.

Read more about Audience

Followers for each connected account, read live, with the change since the earliest reading we stored.

Ad campaigns

Spend, impressions, clicks, CTR and CPC for every campaign on a connected Meta ad account.

Read more about Ad campaigns

Every campaign on a connected Meta ad account with spend, impressions, clicks, CTR and CPC, split between Facebook and Instagram delivery.

Numbers that are not the same thing

Most dashboards hide these differences. We print them.

Engagement rates and follower counts mean different things per platform, so they are never summed, and a blank shows as unavailable, not zero.

Read more about Numbers that are not the same thing
  • Engagement rate means a different quantity on each platform. The dashboard states what it means for each one, and the totals are not added together.
  • Followers are different units. A YouTube subscriber, an Instagram follower and a Facebook Page follower are counted differently, and one person who follows two channels counts in both. Cybe Social shows them side by side and never sums them into a single audience figure.
  • A blank is not a zero. LinkedIn does not report followers for personal profiles, and a YouTube channel can hide its subscriber count. Those show as unavailable with a note, not as 0.
  • Growth needs two readings. An account connected today has no growth figure until it has been read on two different days. It shows as not yet available, not as flat.

Ad campaigns, read-only

Fig. 01 Overhead: one post riding each cable to its account screen

The ad view reads every campaign on the account in its own currency. Cybe Social cannot create, edit, pause or fund one.

Read more about Ad campaigns, read-only

The ad view reads everything on the ad account, including campaigns made in Ads Manager years ago and campaigns someone else created, not only ones linked to posts from Cybe Social. Amounts are in the ad account's currency, and figures from two ad accounts are never added together.

The default window is all time. To match a number someone is reading in Ads Manager, pick the same date range; a mismatched window is the usual reason two numbers disagree.

Cybe Social holds read access only. It cannot create, edit, pause or fund a campaign. For cross-channel reporting that joins Meta Ads with Google Ads, GA4 and your CRM, we build marketing intelligence dashboards as a separate service.

Questions

Why does my follower growth show nothing?

Growth needs readings from two different days. It fills in after the account has been read on a second day.

Can I see analytics for posts made outside Cybe Social?

Post analytics cover posts published through Cybe Social. The platform dashboards and the ad view read wider account data.

Can I export the numbers?

Ask us in the demo what export you need. If you need data joined across tools, a dashboard project is the better fit.

Last updated